|
|||||||||||||||
 |
|||||||||||||||
|
|
|||||||||||||||
________________
____________________
|
«ÍżµěáÇĂěŕľ×čč͡ŇĂľÂҡóě Forecast Pro (Forecasting Software) Forecast Pro XE
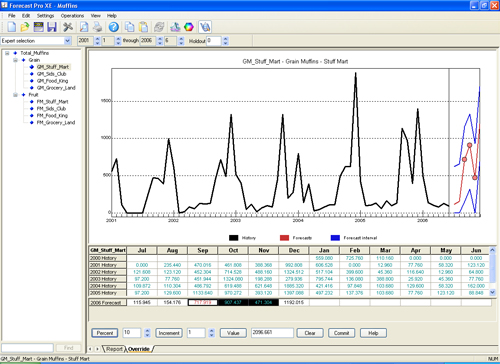
Add Your Business Knowledge Forecast Pro XE lets you adjust your forecasts on a
graph or in a spreadsheet-like display—in either view, you see both
the historical data and forecasted values, allowing you to easily compare
patterns within the data. You can adjust single points, ranges or totals,
using percentages, increments or by simply entering new values. If you’ve
defined a multiple-level hierarchy, adjusting a value at any given level
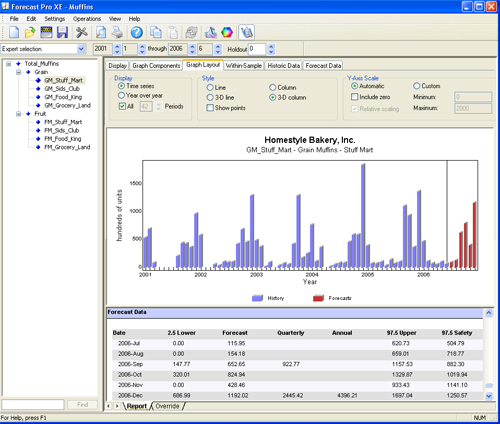
will automatically adjust all appropriate levels. Make Convincing Presentations With Forecast Pro XE, you can create dazzling, presentation-quality
reports in seconds. Four professionally-designed standardized report
formats are included as well as a custom reporting option for maximum
flexibility. You can graph your results on a time series or year-over-year
basis, choose from several eye-catching formats including 3-D lines
and 3-D columns, and save your reports directly to Excel. Work With Your Existing Data Forecast Pro XE imports data in a variety of flexible, easy-to-create formats including Excel and Lotus spreadsheets, text files and ODBC. These flexible formats allow you to easily import and export data from virtually any source. There is also an on-line editor to enter your data directly, or to modify and amend files. Diagnose Your Models Forecast Pro XE provides a standardized set of diagnostic screens to help you compare and evaluate models. You get graphs of the residuals and the error autocorrelation function, grid displays of the correlation matrix and covariance matrix, as well as key numeric statistics: Adjusted R-Square, MAPE, Sample Size, Mean, Schwartz BIC, Ljung-Box, RMSE, Standard Deviation, MAD, R-Square and Standard Forecast Error. Evaluate Alternative Forecasts If you define a holdout sample, Forecast Pro XE will automatically generate out-of-sample MAPE, MAD and GMRAE statistics to measure forecast performance. This handy feature allows you to quickly evaluate different models and answer questions like "How accurate would my forecasts have been had I used Forecast Pro XE last year?"
|
||||||||||||||


|
M-Focus Co., Ltd.   I-Tower Bldg., 14th Flr., 888 Vipavadee-Rangsit Rd., Jatujak, Bangkok 10900, Thailand Marketing: (662) 513-9892 ext.151 Fax: (662) 512-3890 Location Map E-mail: kie@m-focus.co.th Copyright © 2008, M-Focus Co.Ltd. All Rights Reserved. |